How to Stop Being Fooled by Clinical Trial Headlines: 7 Stats Lessons for the Modern Practitioner
Introduction: The P&T Committee Anxiety
Imagine you are sitting in a Pharmacy and Therapeutics (P&T) committee meeting. A new study is on the agenda, and the summary in front of you highlights a "20% reduction" in a primary outcome with a statistically significant p-value. The pressure to adopt the new therapy is immediate.
However, as a strategist knows, clinical trial results are often pre-summarized in ways that obscure their actual clinical value. Headlines favor relative figures because they sound impressive, but they don't answer the question a practitioner actually needs to solve: "How much would change for my patients if I did this?"
To make better decisions, you need a mental toolkit for "reading between the lines" of clinical statistics.
Takeaway 1: The Relative Risk Illusion (Relative vs. Absolute)
Relative percentages are misleading because they hide the baseline rate of an event. A "10% reduction" sounds significant, but its importance depends entirely on the starting point.
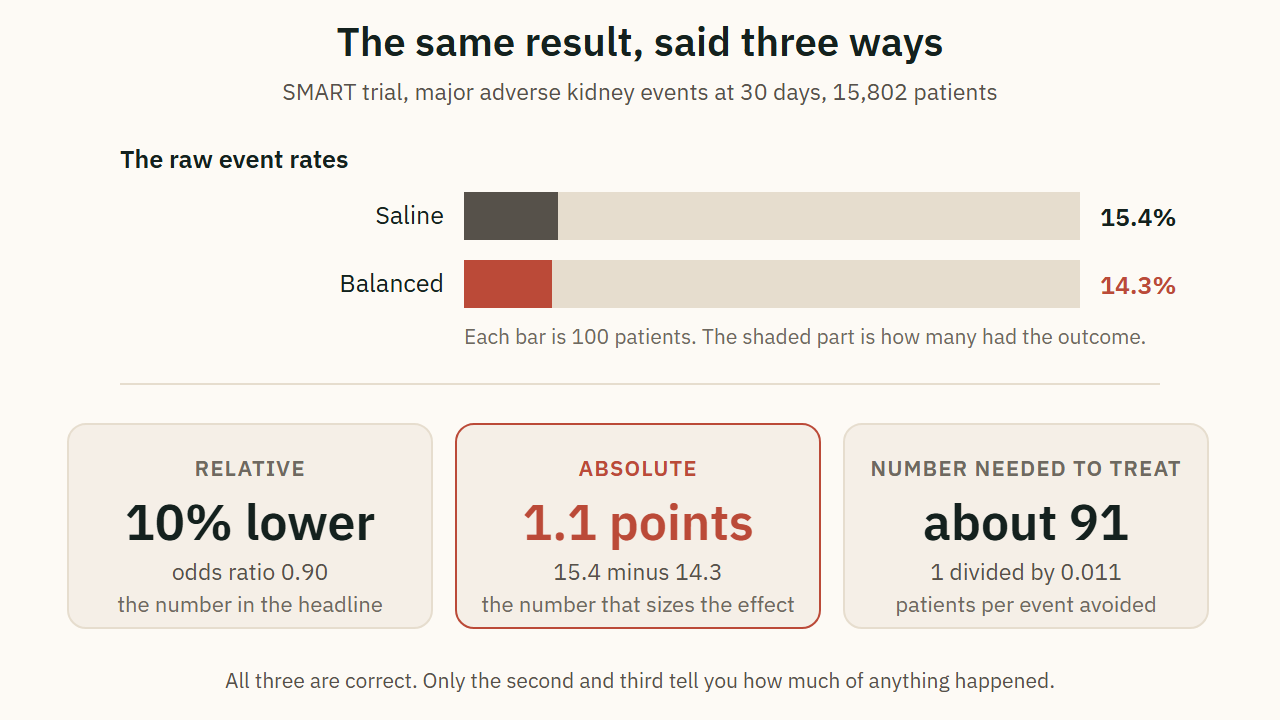
Consider the SMART trial data. The study reported an odds ratio of 0.90 for major adverse kidney events, a 10% relative reduction. However, the actual event rates were 15.4% in the saline group and 14.3% in the balanced crystalloid group. The absolute difference is only 1.1 percentage points.
To find the clinical reality, use "one-line arithmetic" to calculate the Number Needed to Treat (NNT). Subtract the two event rates to find the absolute risk reduction, then divide 1 by that decimal.
The One-Line Arithmetic:
4% - 14.3% = 1.1% (or 0.011)
1 / 0.011 = 91 patients treated per event avoided
Whether 91 is a "good" number depends on context. For low-cost interventions like intravenous fluids, treating 91 patients to avoid one major kidney event is an excellent value proposition. For a drug costing $2,000 per course, an NNT of 91 represents a much more difficult conversation for a hospital budget.
Takeaway 2: The P-Value is Not a Magnitude Gauge
A p-value answers exactly one narrow question: if there were no real difference between groups, how often would data this extreme appear by chance? It is not a measure of how well a treatment works, nor is it a trophy of clinical importance.
This leads to the "Large Trial Trap." In massive cohorts, statistical significance becomes an inevitability, not a trophy. With enough patients, even a tiny, clinically irrelevant difference can become statistically significant. Conversely, remember that "Not Significant" does not mean "No Difference." A p-value above 0.05 often simply means the trial was too small to rule out chance, it is a failure of the trial to find an answer, not a proof of equality.
Takeaway 3: Confidence Intervals Tell the Real Story
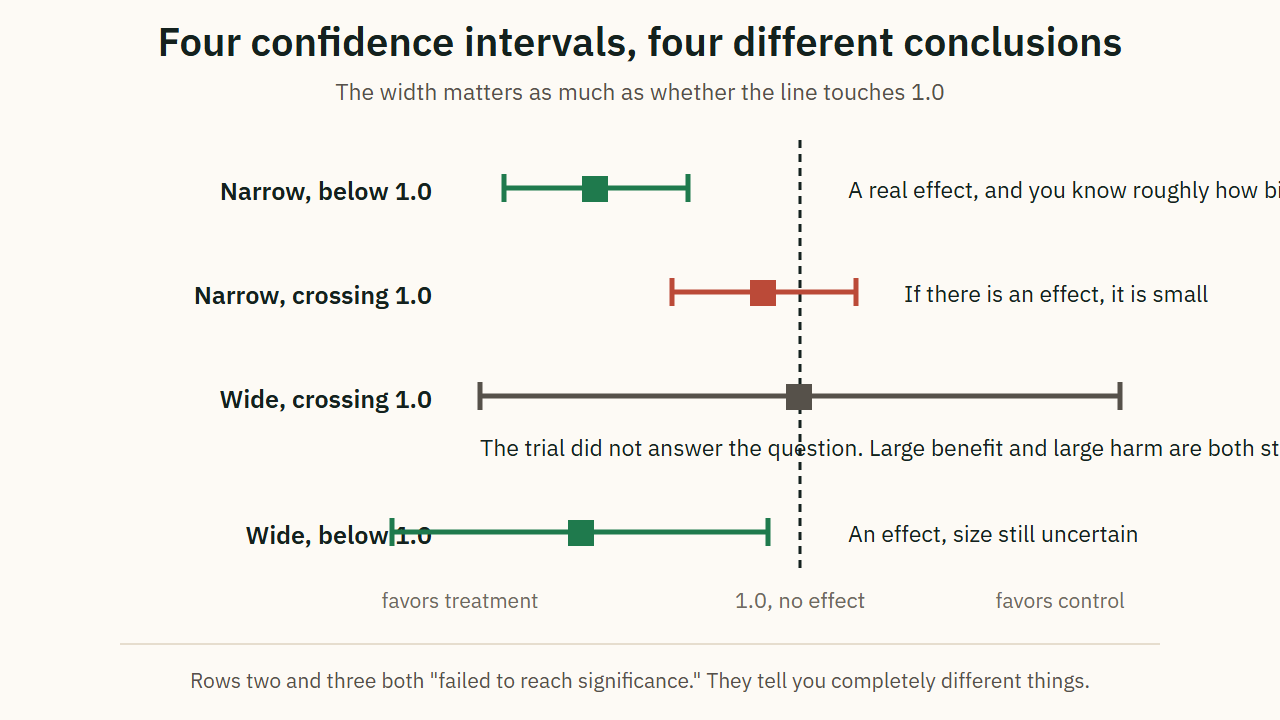
While a p-value is a binary "yes/no" on chance, the confidence interval (CI) provides the range of effects compatible with the data. The width of this interval is far more informative than a p-value.
Look at the PLUS trial, which examined 90-day mortality. It reported a difference of -0.15 percentage points with a 95% CI of -3.60 to 3.30 (p=0.90). This is a "null" result, but the narrowness of the interval is highly informative. Because the range is tight and centered near zero, it provides genuine evidence that any mortality effect, if it exists, is likely very small. It effectively excludes the "clinically meaningful" differences, like a 5% mortality reduction, that would usually drive a change in practice.
When reading a trial, "read the ends of the interval." Ask yourself if you would act differently if the true effect were at either extreme. If the answer is "no" at both ends, the trial has settled the question regardless of the p-value.
Takeaway 4: What's Hiding Inside the Composite Outcome?
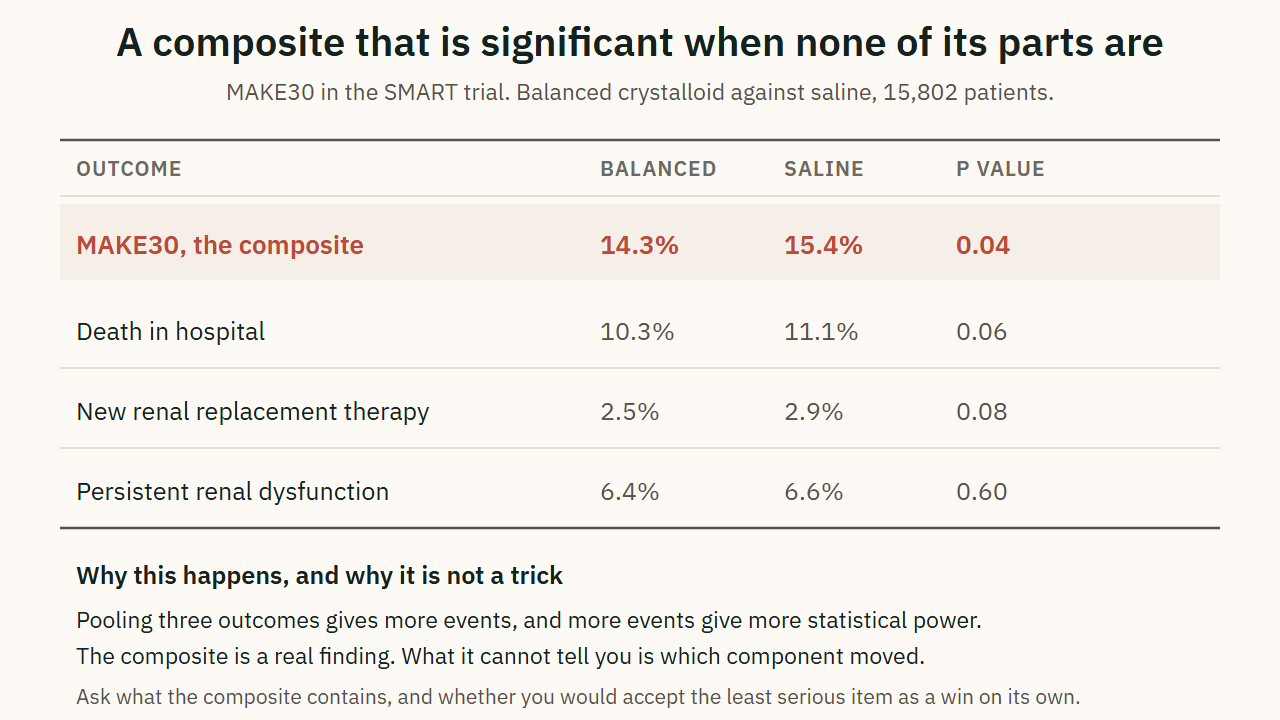
Researchers often use composite outcomes, such as the MAKE30 outcome in the SMART trial, which combines death, new renal replacement therapy, or persistent renal dysfunction.
Composites increase statistical power by pooling events, but they can be driven by the most common, least serious component. In SMART, the composite reached statistical significance (p=0.04), yet the individual secondary endpoints (the exploratory components) did not:
-
In-hospital death: p=0.06
-
New renal replacement therapy: p=0.08
-
Persistent renal dysfunction: p=0.60
This isn't a defect, but it requires a litmus test: Would you accept the least serious item in the composite as a win on its own? If you wouldn't change your practice for the minor component (like a minor rise in creatinine) alone, the composite may be answering a different question than the one you are asking.
Takeaway 5: The "Power" Behind Apparent Contradictions
Practitioners are often frustrated when trials seem to disagree. However, trials are powered for specific target effect sizes and primary outcomes.
For example, the SMART, BaSICS, and PLUS trials might seem to contradict one another regarding fluid choice. But SMART was powered for a kidney composite (a more frequent event) and found a 1.1% difference. BaSICS and PLUS were powered for mortality.
Mortality is a much "harder" and less frequent endpoint than a kidney composite. A 1.1 percentage point difference in kidney outcomes simply won't move the needle on mortality in a trial of 5,000 patients; it lacks the statistical power to do so. This is a "power problem" being mistaken for an "evidence problem." These trials actually agree: there is a small effect concentrated in kidney outcomes that doesn't necessarily translate to a survival benefit.
Takeaway 6: Subgroups are Just Suggestions
Subgroup results are essentially "trials within trials." They lack the protection of the primary analysis because they suffer from multiplicity, the more you look, the more likely you are to find a "significant" result by sheer chance, and they are rarely factored into the initial power calculation.
Consider the traumatic brain injury (TBI) subgroup in the crystalloid pooled analysis. It showed an odds ratio for mortality of 1.42 for balanced fluids, suggesting potential harm. While this is hypothesis-generating and not a proof of harm, it justifies a strategic "carve-out."
Match the strength of your response to the strength of the evidence. A subgroup finding justifies avoiding a specific treatment in a specific population where a plausible mechanism exists, but it does not justify a "hard stop" for the entire hospital.
Takeaway 7: Posterior Probability, The Intuitive Future
Bayesian analysis is becoming more common because it answers the question clinicians actually have: "How likely is it that this works?"
The BEST-Living meta-analysis used "vague priors", meaning they started with a neutral assumption that either fluid could be better, and found an 89.5% posterior probability of benefit for balanced crystalloids. This was true even though the 95% CI (0.91 to 1.01) crossed the line of no effect.
However, a Senior Strategist must separate the probability of benefit from the size of benefit. An 89.5% probability that a treatment is "better" doesn't mean it is "much better." A high probability of a tiny benefit supports a low-cost default practice, but it does not support a clinical mandate or a high-priced formulary addition.
Conclusion: The One Habit to Rule Them All
If you adopt only one habit from this toolkit, let it be this: Subtract the event rates. Find the absolute difference before you read the relative headline, the p-value, or the abstract's conclusion.
The next time a major trial hits your desk, ask yourself: "Is this result changing my practice, or is it just changing my p-value?"
Related
- Which crystalloid should your ICU default to?, where most of these examples come from
- What actually changed in the 2025 hypertension guideline
- SMART in NEJM, the source of the composite example
- The BEST-Living meta-analysis, the source of the posterior probability example
- Running the Clinical Program, on taking evidence to a committee and getting a decision
Want the practice knowledge behind this?
Your First Year as a Hospital Pharmacist covers the clinical judgment a residency front-loads. Part of the Pharmacy Handoff library.
See the book